How to Master DevOps with Python, Terraform, and Kubernetes on AWS
Introduction
As a DevOps engineer, I am usually involves with pipelines, automation, and cloud services. However, I've always been curious about the other side of the tech world which is application development. So, I thought, why not mix things up a bit? That's how I found myself building a Python financial app, complete with a REST API.
This blog post documents the journey of developing and deploying my mock financial application from scratch, from coding the initial app to its deployment on AWS using Docker, Kubernetes (EKS), Terraform, and Ansible. And guess what? I've automated the whole process - every single bit of it!
If you're itching to see how it all came together, check out my GitHub repository for all the details.
 bobocuillere
In this article, we'll learn:
- Python Development: We'll explore how I used Flask to create a Python-based REST API application.
- Containerization and Orchestration: I'll share the benefits I discovered in using Docker and Kubernetes for deploying applications.
- Scripting: You'll learn how Python and Bash scripting became my go-to for automating key tasks, boosting both efficiency and reliability.
- Terraform for Infrastructure: I'll walk you through my experience using Terraform to define and provision cloud infrastructure.
- Ansible for Configuration Management: I'll show how Ansible made configuring monitoring tools (like Prometheus and Grafana) a breeze.
- CI/CD Practices: And finally, I'll share insights on implementing a CI/CD pipeline with GitHub Actions for a deployment that's both consistent and automated.
I -Architecture
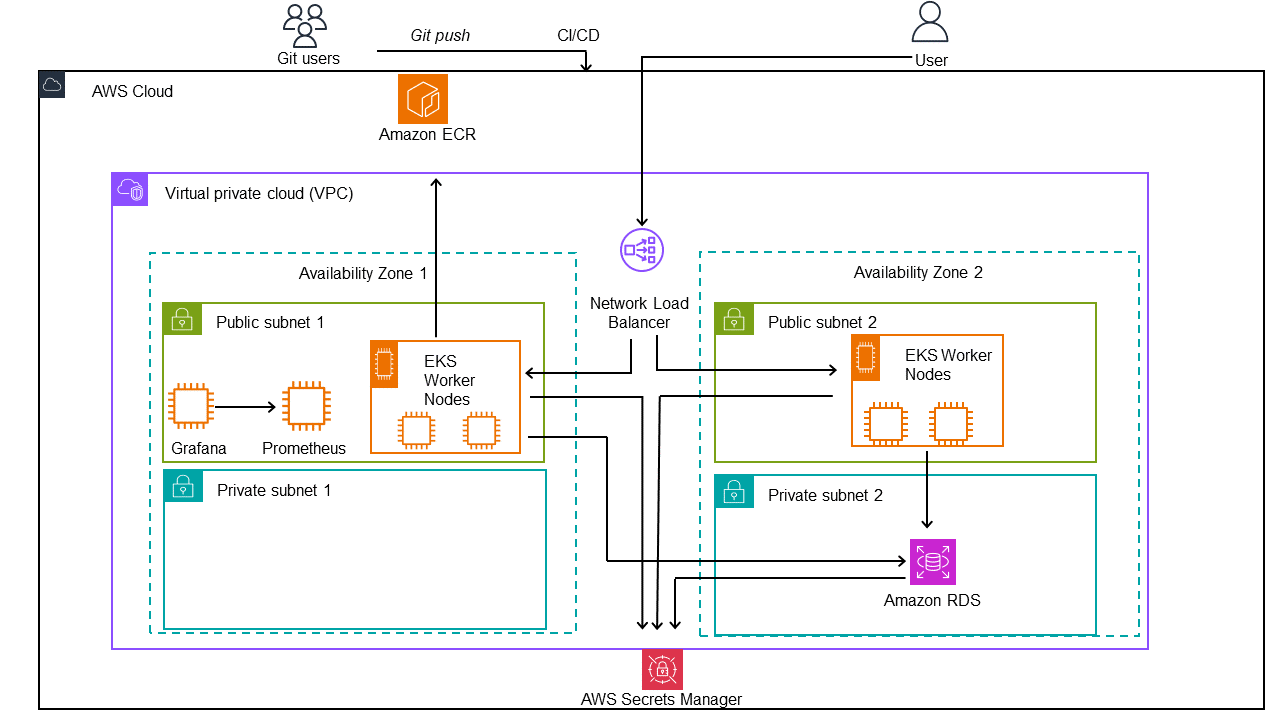
In our project, we integrate cloud-based services with external tools and continuous integration/deployment (CI/CD) using GitHub Actions to create a robust and scalable application.
Step 1: Code Commit to Deployment
- Git Users: It all starts with developers committing code to a Git repository.
- Git Push: Committing code triggers a push to the remote repository, setting in motion the automated CI/CD pipeline.
- CI/CD Pipeline: Using GitHub Actions, this pipeline becomes automates the building, testing, and deployment of the application and the infrastructure seamlessly.
Step 2: Building and Storing the Docker Image
- Amazon ECR: Once built, the application’s Docker image is sent to Amazon ECR, a container registry.
Step 3: Infrastructure Provisioning
- VPC and Availability Zones: The VPC forms the core of the network architecture, providing isolation and routing, while Availability Zones offer redundancy and high availability.
- Public Subnet: Host internet-facing services, including EKS Worker Nodes and monitoring tools.
- Private Subnet: Enhances security by hosting services like the Amazon RDS out of direct internet reach.
- Network Load Balancer: This acts as a traffic director, ensuring efficient and reliable handling of user requests.
Step 4: Securing Secrets and Database Connectivity
- AWS Secrets Manager: A vault for sensitive information like database credentials and API keys, crucial for secure database and service access.
Step 5: User Interaction with the Application
- User: The end-user interacts with the application via the Network Load Balancer, which intelligently routes their requests to the backend services on EKS Worker Nodes.
Step 6: Interaction Between Components
- EKS Worker Nodes and AWS Secrets Manager: The application is hosts on the EKS nodes , to communicate with the RDS, it retrievethe credentials from Secrets Manager.
- RDS Database and AWS Secrets Manager: The RDS instance integrates with Secrets Manager for credential retrievals.
II - Building with Python
I structured the application with the following main components:
- app.py: The main Flask application file.
- models.py: To define database models (like Users, Accounts, Transactions).
- views.py: To handle the routing and logic of the application.
- templates/: A directory for HTML templates.
- static/: A directory for static files like CSS, JavaScript, and images.
- tests/: For unit test scripts.
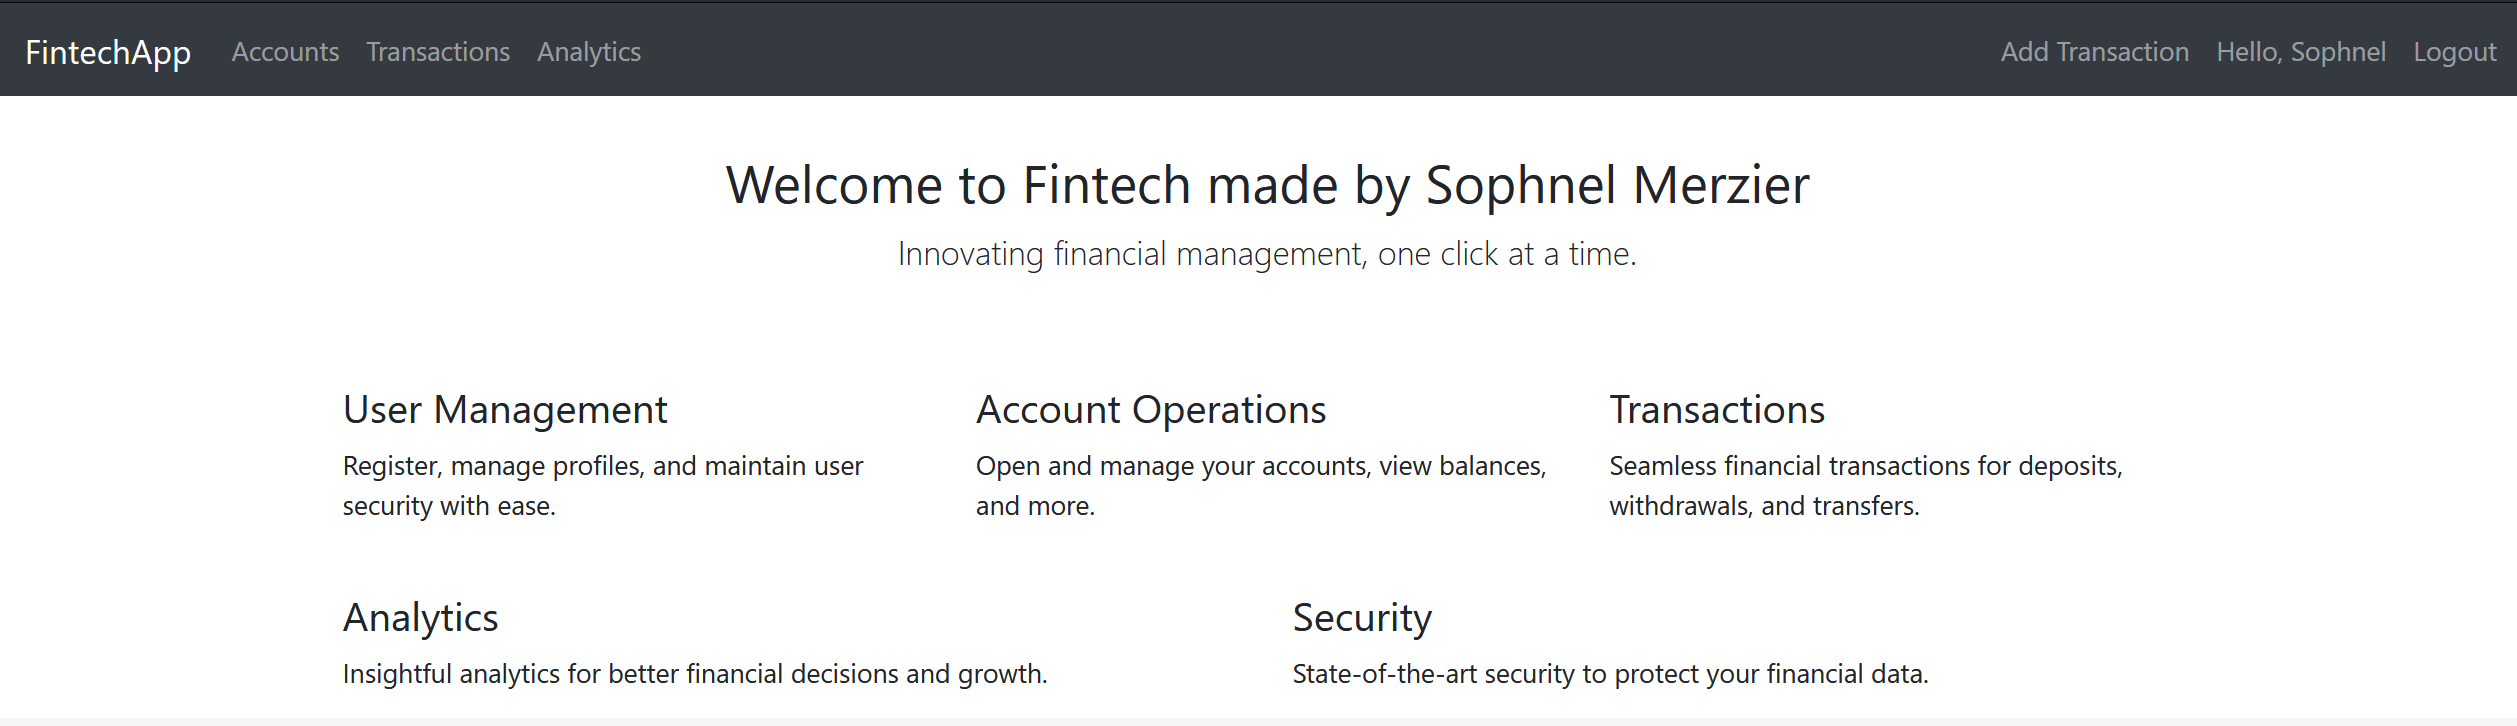
Key Features
Building the REST API was interesting from a learning point pesperctive as it was my first time coding one. I structured endpoints to manage user authentication, accounts, and transactions.
I coded the logic to manage different transaction types such as deposits and withdrawals, ensuring accurate balance updates and transaction validations.
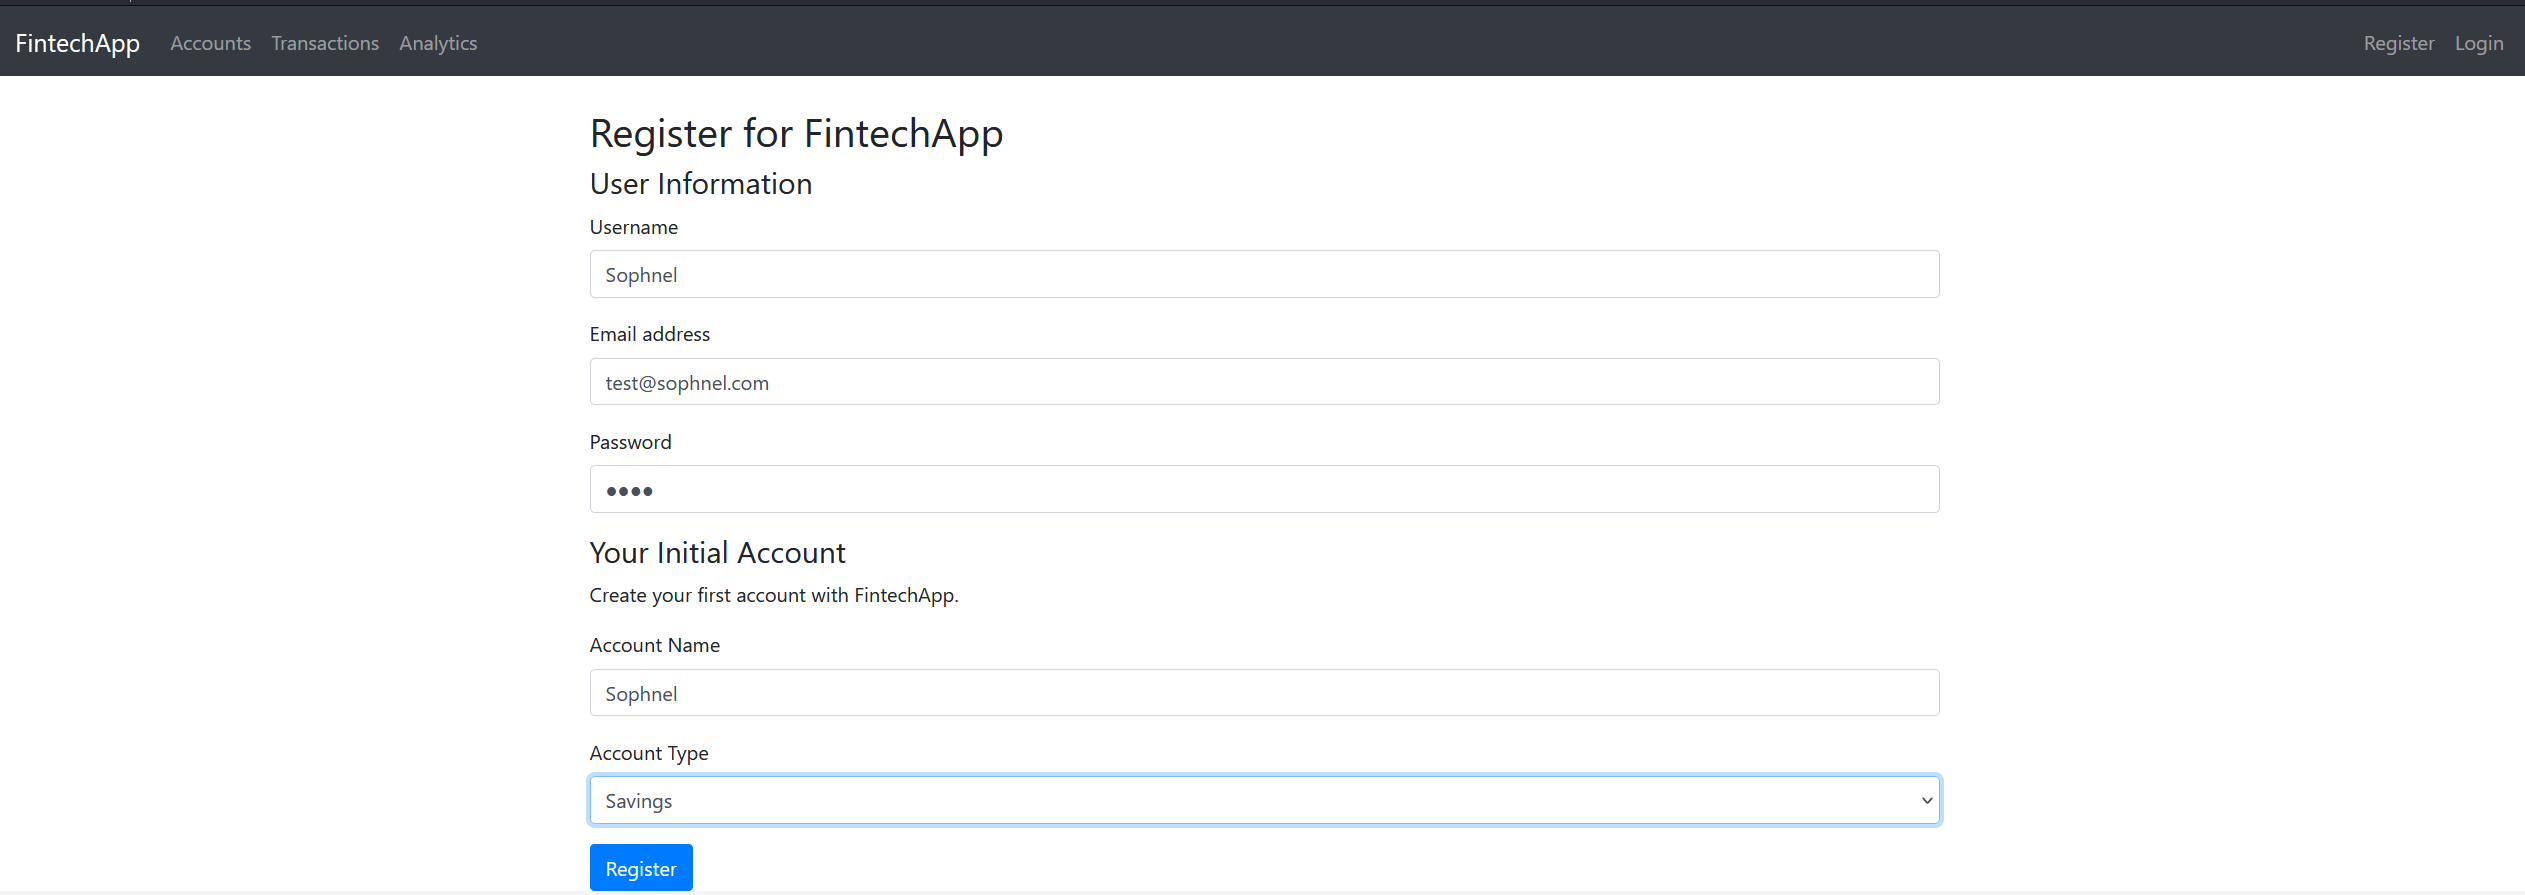
- User Registration and Authentication:
- Secure user registration and login system.
- Password hashing for security.
- Session-based user authentication.
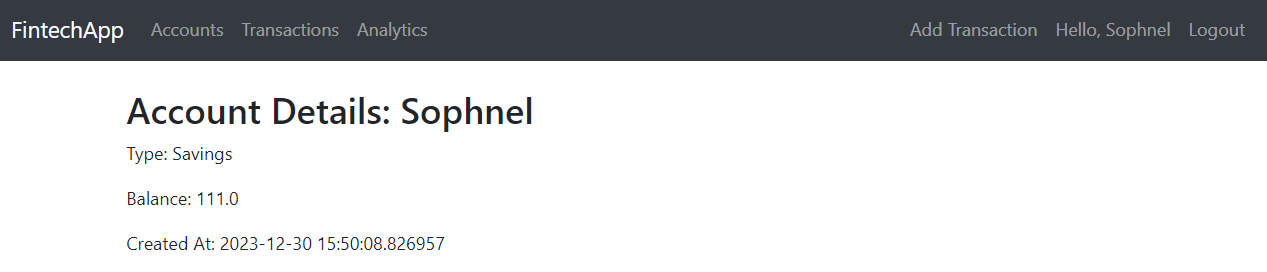
2. Account Operations:
- Creation of financial accounts.
- Viewing account details including balance and created date.
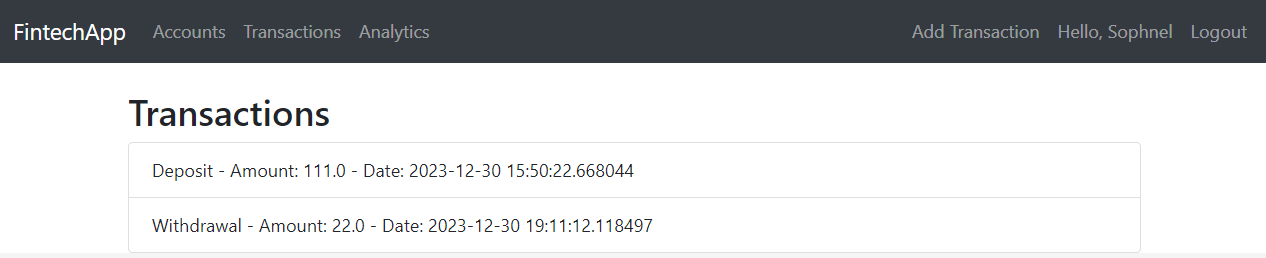
3. Transaction Management:
- Performing deposit and withdrawal transactions.
- Viewing a list of transactions for each account.
III - Docker
Docker is a platform for developing, shipping, and running applications inside containers. Containers are lightweight, standalone, and executable software packages that include everything needed to run an application: code, runtime, system tools, system libraries, and settings.
The main goal was to ensure our application scales efficiently and runs consistently across different environments.
I'll share how I approached this task, the key questions that guided my decisions, and the rationale behind the choices I made.
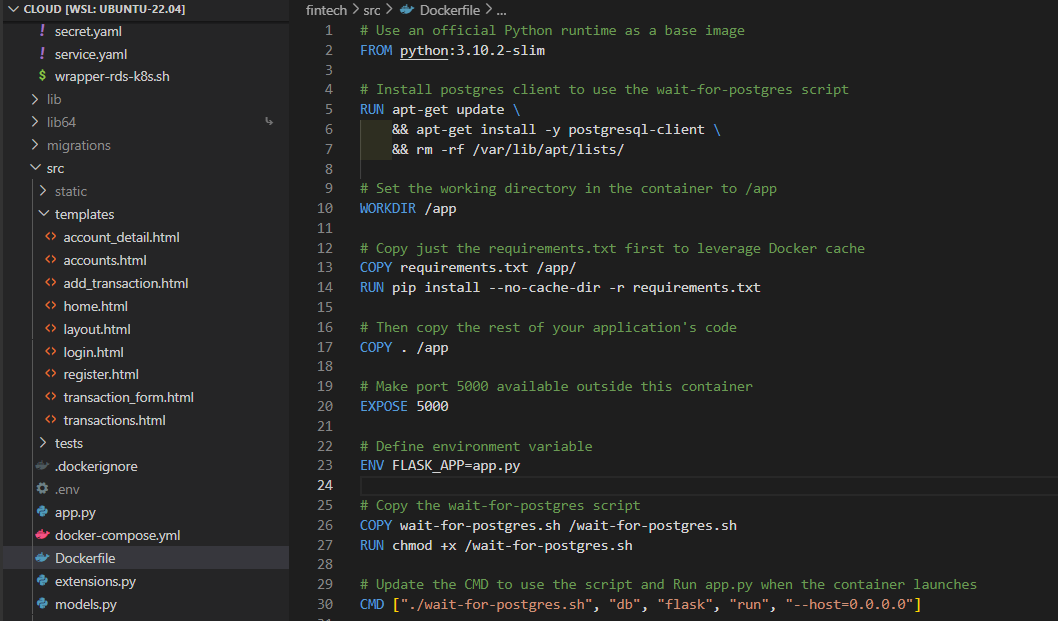
The Dockerfile
A Dockerfile is a text document containing commands to assemble a Docker image. The Docker image is a lightweight, standalone, executable package that includes everything needed to run your application.
-
Selecting the Base Image:
FROM python:3.10.2-slim: A slim version of Python was chosen as the base image for its balance between size and functionality. It provided just the necessary components required to run our Flask application without the overhead of a full-fledged OS.
-
Installing PostgreSQL Client:
- The decision to install a PostgreSQL client (
postgresql-client) was made to support ourwait-for-postgres.shscript. This was a crucial part of ensuring that the Flask application only starts after the database is ready to accept connections.
- The decision to install a PostgreSQL client (
-
Optimizing for Docker Cache:
- By copying only the
requirements.txtfile initially and installing dependencies, we leveraged Docker’s caching mechanism. This meant faster builds during development, as unchanged dependencies wouldn't need to be reinstalled each time.
- By copying only the
-
Setting Up the Application:
- Copying the application code into the
/appdirectory and setting it as the working directory established a clear and organized structure within the container.
- Copying the application code into the
-
Exposing Ports and Setting Environment Variables:
EXPOSE 5000andENV FLASK_APP=app.py: These commands made our application accessible on port 5000 and specified the entry point for our Flask app.
-
Implementing the Wait Script:
- The
wait-for-postgres.shwas a decision to handle dependencies between services, particularly ensuring the Flask app doesn’t start before the database is ready.
- The
Docker Compose for Local Developement
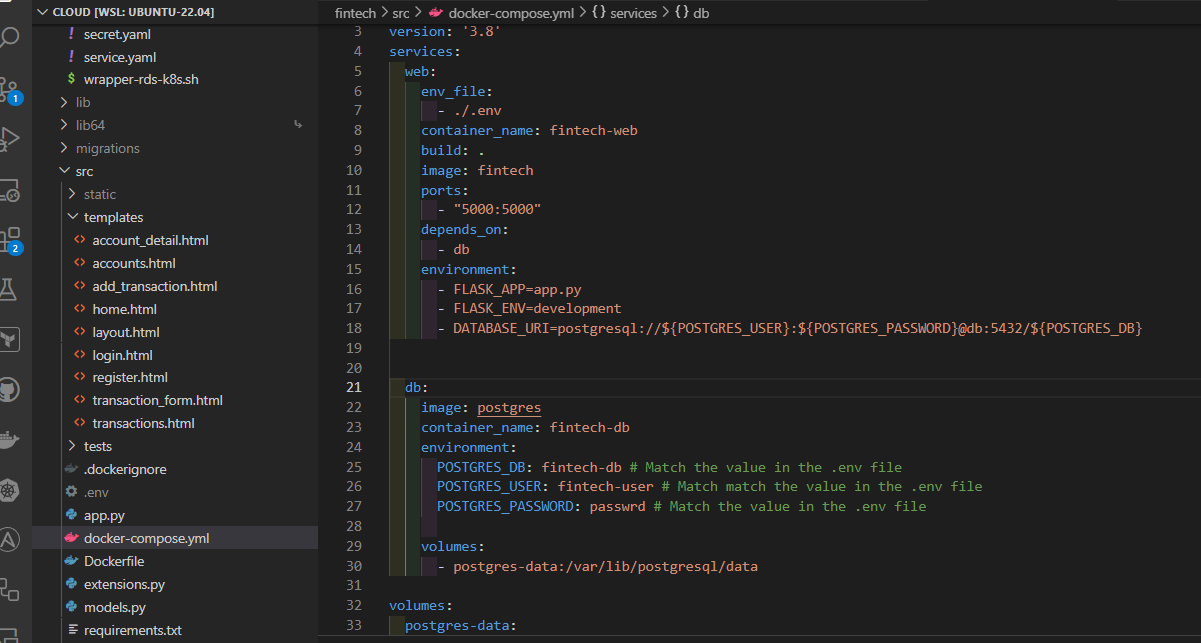
The docker-compose.yml file played a role in defining and linking multiple services (the Flask app and PostgreSQL database).
- Environment variables like
DATABASE_URIwere configured to dynamically construct the database connection string, ensuring flexibility and ease of configuration.
Database Configuration:
- Setting up PostgreSQL as a separate service with its environment variables (
POSTGRES_DB,POSTGRES_USER,POSTGRES_PASSWORD) allowed for an isolated and controlled database environment. This separation is crucial in a microservices-oriented architecture.
Reflecting on this dockerization process, several key lessons stand out:
- Flexibility and Control: Docker provided a level of control over the application's environment that is hard to achieve with traditional deployment methods.
- Problem-Solving: Implementing the
wait-for-postgres.shscript was a practical solution to a common problem in containerized environments – managing service dependencies. - Best Practices: The entire process reinforced the importance of understanding and implementing Docker best practices, from choosing the right base image to optimizing build times and ensuring service availability.
IV - Migrate to AWS
After successfully containerizing the application, the next phase was moving it to AWS and create a monitoring infrastructure with Prometheus and Grafana.
Terraform for Infrastructure as Code
To automate the cloud infrastructure setup, I used Terraform.
You can find below the architecture.
.
├── backend.tf
├── fintech-monitoring.pem
├── main.tf
├── modules
│   ├── ec2
│   │   ├── main.tf
│   │   ├── outputs.tf
│   │   └── variables.tf
│   ├── eks
│   │   ├── main.tf
│   │   ├── outputs.tf
│   │   └── variables.tf
│   ├── rds
│   │   ├── main.tf
│   │   ├── outputs.tf
│   │   └── variables.tf
│   ├── security_groups
│   │   ├── main.tf
│   │   ├── outputs.tf
│   │   └── variables.tf
│   └── vpc
│       ├── main.tf
│       ├── outputs.tf
│       └── variables.tf
├── outputs.tf
├── provider.tf
├── terraform.tfvars
└── variables.tfI structured my Terraform configuration into distinct modules, each focusing on different aspects of the AWS infrastructure. This modular design enhanced readability, reusability, and maintainability.
- VPC Module: Set up the Virtual Private Cloud (VPC) for network isolation, defining subnets, route tables, internet gateways.
- EKS Module: Deployed the Amazon Elastic Kubernetes Service (EKS) cluster. This module handled the setup of the Kubernetes control plane, worker nodes, and necessary IAM roles for EKS.
- RDS Module: Created a PostgreSQL database instance using Amazon RDS. This module managed database configurations, including instance sizing, storage, and network access.
- Security Groups Module: Defined security groups needed for any parts of our infrastructure, ensuring tight security boundaries.
- Monitoring Module: Create the EC2 instances for the monitoring infrastructure.
Ansible for Prometheus and Grafana
For further automation about the monitoring configuration, I utilized Ansible. It played a crucial role in automating repetitive tasks, ensuring that the environment was configured correctly.
- Prometheus Configuration: I wrote an Ansible playbook to set up Prometheus. This playbook handled the installation of a Prometheus server.
- Grafana Setup: Another playbook was dedicated to Grafana. It automated the installation of Grafana.
- Templates: We utilized Ansible templates to dynamically generate configuration files. For instance, we had Jinja2 templates for Prometheus and Grafana.
- Handlers: Ansible handlers were used to manage services post-configuration changes. For example, when the Prometheus configuration was altered, a handler ensured that the Prometheus service was reloaded to apply the new settings.
Custom Scripts
Python and Bash scripts to automate various aspects of the infrastructure and monitoring setup. These scripts were designed to complement the Terraform and Ansible configurations, ensuring a seamless and automated workflow. Here's a detailed overview of each script and its purpose in the project:
1. update_inventory.py
import json
import boto3
import yaml

# Load vars.yml
with open('vars.yml') as file:
    vars_data = yaml.safe_load(file)
aws_region = vars_data['aws_region']

def get_instance_ip(instance_name):
    ec2 = boto3.client('ec2', region_name=aws_region)

    response = ec2.describe_instances(
        Filters=[
            {'Name': 'tag:Name', 'Values': [instance_name]},
            {'Name': 'instance-state-name', 'Values': ['running']}
        ]
    )

    for reservation in response['Reservations']:
        for instance in reservation['Instances']:
            ip_address = instance.get('PublicIpAddress')
            print(f"IP for {instance_name}: {ip_address}")
            return ip_address
    print(f"No running instance found for {instance_name}")
    return None

def update_inventory():
    grafana_ip = get_instance_ip('Grafana-Server')
    prometheus_ip = get_instance_ip('Prometheus-Server')

    inventory_content = f'''
all:
  children:
    grafana:
      hosts:
        {grafana_ip}:
    prometheus:
      hosts:
        {prometheus_ip}:
    '''

    with open('./inventory.yml', 'w') as file:
        file.write(inventory_content.strip())

    with open('./roles/grafana/templates/grafana.ini.j2', 'r') as file:
        lines = file.readlines()

    with open('./roles/grafana/templates/grafana.ini.j2', 'w') as file:
        for line in lines:
            if line.strip().startswith('domain'):
                file.write(f'domain = {grafana_ip}\n')
            else:
                file.write(line)

def update_env_file(grafana_ip, prometheus_ip):
    env_content = f'''
export GRAFANA_URL='https://{grafana_ip}:3000'
export GRAFANA_ADMIN_USER='admin'
export GRAFANA_ADMIN_PASSWORD='admin'
export PROMETHEUS_URL='https://{prometheus_ip}:9090'
'''
    with open('.env', 'w') as file:
        file.write(env_content.strip())

if __name__ == '__main__':
    update_inventory()
    grafana_ip = get_instance_ip('Grafana-Server')
    prometheus_ip = get_instance_ip('Prometheus-Server')
    update_env_file(grafana_ip, prometheus_ip)
- Context: Managing dynamic IP addresses in a cloud environment can be challenging, especially when dealing with Ansible inventories.
- Purpose: This script was designed to automatically update the Ansible inventory and the .env file with the latest IP addresses of the deployed AWS instances.
- How it Works: It queries the AWS API to retrieve the current IP addresses of instances and updates the Ansible inventory file accordingly. This ensured that Ansible always had the correct IPs for configuration tasks, especially useful after infrastructure updates that might change instance IPs.
2. generate_grafana_api_key.py
import requests
import os
import boto3
import json
import yaml
from dotenv import load_dotenv
import subprocess
import time

load_dotenv()  # This loads the variables from .env into the environment

# Load vars.yml
with open('vars.yml') as file:
    vars_data = yaml.safe_load(file)
aws_region = vars_data['aws_region']

def get_terraform_output(output_name):
    command = f" cd ../terraform/ && terraform output -raw {output_name}"
    process = subprocess.Popen(command, stdout=subprocess.PIPE, stderr=subprocess.PIPE, shell=True)
    stdout, stderr = process.communicate()

    if stderr:
        print("Error fetching Terraform output:", stderr.decode())
        return None

    return stdout.decode().strip()

# Function to generate Grafana API key
def generate_grafana_api_key(grafana_url, admin_user, admin_password):
    headers = {
        "Content-Type": "application/json",
    }
    timestamp = int(time.time())
    payload = {
        "name": f"terraform-api-key-{timestamp}",
        "role": "Admin"
    }
    response = requests.post(f"{grafana_url}/api/auth/keys", headers=headers, json=payload, auth=(admin_user, admin_password))
    if response.status_code == 200:
        return response.json()['key']
        print("API key generated successfully.")
    else:
        print(f"Response status code: {response.status_code}")
        print(f"Response body: {response.text}")
        raise Exception("Failed to generate Grafana API key")

# Function to update AWS Secrets Manager
def update_secret(secret_id, new_grafana_api_key):
    client = boto3.client('secretsmanager', region_name=aws_region)
    secret_dict = json.loads(client.get_secret_value(SecretId=secret_id)['SecretString'])
    secret_dict['grafana_api_key'] = new_grafana_api_key

    client.put_secret_value(SecretId=secret_id, SecretString=json.dumps(secret_dict))

    # Debugging step: Check if the secret is really updated on AWS
    updated_secret_dict = json.loads(client.get_secret_value(SecretId=secret_id)['SecretString'])
    if updated_secret_dict['grafana_api_key'] == new_grafana_api_key:
        print("Secret successfully updated on AWS.")
    else:
        print("Failed to update secret on AWS.")

if __name__ == "__main__":
    grafana_url = os.environ.get('GRAFANA_URL')
    admin_user = os.environ.get('GRAFANA_ADMIN_USER')
    admin_password = os.environ.get('GRAFANA_ADMIN_PASSWORD')
    secret_id = get_terraform_output("rds_secret_arn")  # From the terraform output

    api_key = generate_grafana_api_key(grafana_url, admin_user, admin_password)
update_secret(secret_id, api_key)- Context: For integrating Grafana with external tools or automating dashboard configurations, an API key is required.
- Purpose: This script automated the creation of a Grafana API key and save it to AWS Secrets Manager.
- How it Works: It interacted with Grafana's API to generate a new API key with the necessary permissions. This key was then used in subsequent scripts for dashboard setup and data source configuration, avoiding manual intervention in the Grafana UI.
3. add_grafana_dashboard.py
import requests
import boto3
import json
import os
import yaml
import subprocess
from dotenv import load_dotenv

load_dotenv()  # This loads the variables from .env into the environment

# Load vars.yml
with open('vars.yml') as file:
    vars_data = yaml.safe_load(file)
aws_region = vars_data['aws_region']

def get_terraform_output(output_name):
    command = f"cd ../terraform && terraform output -raw {output_name}"
    process = subprocess.Popen(command, stdout=subprocess.PIPE, stderr=subprocess.PIPE, shell=True)
    stdout, stderr = process.communicate()

    if stderr:
        print("Error fetching Terraform output:", stderr.decode())
        return None

    return stdout.decode().strip()

def get_grafana_api_key(secret_id):
    client = boto3.client('secretsmanager', region_name=get_terraform_output("aws_region"))
    secret = json.loads(client.get_secret_value(SecretId=secret_id)['SecretString'])
    return secret['grafana_api_key']


def add_prometheus_data_source(grafana_url, api_key, prometheus_url):
    headers = {
        "Authorization": f"Bearer {api_key}",
        "Content-Type": "application/json"
    }
    # Check if data source exists
    get_response = requests.get(f"{grafana_url}/api/datasources/name/Prometheus", headers=headers)

    if get_response.status_code == 200:
        # Data source exists, update it
        data_source_id = get_response.json()['id']
        data_source_config = get_response.json()
        data_source_config['url'] = prometheus_url
        update_response = requests.put(
            f"{grafana_url}/api/datasources/{data_source_id}",
            headers=headers,
            json=data_source_config
        )
        if update_response.status_code == 200:
            print("Prometheus data source updated successfully.")
        else:
            print(f"Failed to update Prometheus data source: {update_response.content}")
    else:
        # Data source does not exist, create it
        data_source_config = {
            "name": "Prometheus",
            "type": "prometheus",
            "access": "proxy",
            "url": prometheus_url,
            "isDefault": True
        }
        create_response = requests.post(f"{grafana_url}/api/datasources", headers=headers, json=data_source_config)
        if create_response.status_code == 200:
            print("New Prometheus data source added successfully.")
        else:
            print(f"Failed to add as a new data source: {create_response.content}")


def add_dashboard(grafana_url, api_key, dashboard_json):
    headers = {
        "Authorization": f"Bearer {api_key}",
        "Content-Type": "application/json"
    }
    response = requests.post(f"{grafana_url}/api/dashboards/db", headers=headers, json=dashboard_json)
    if response.status_code == 200:
        print("Dashboard added successfully.")
    else:
        print(f"Failed to add dashboard: {response.content}")

if __name__ == "__main__":
    grafana_url = os.environ.get('GRAFANA_URL')
    secret_id = get_terraform_output("rds_secret_arn")  # From the terraform output
    dashboard_json = {
        "dashboard": {
            "id": None,
            "title": "Simple Prometheus Dashboard",
            "timezone": "browser",
            "panels": [
                {
                    "type": "graph",
                    "title": "Up Time Series",
                    "targets": [
                        {
                            "expr": "up",
                            "format": "time_series",
                            "intervalFactor": 2,
                            "refId": "A"
                        }
                    ],
                    "gridPos": {
                        "h": 9,
                        "w": 12,
                        "x": 0,
                        "y": 0
                    }
                }
            ]
        }
    }

    api_key = get_grafana_api_key(secret_id)
    prometheus_url = os.environ.get('PROMETHEUS_URL')
    add_prometheus_data_source(grafana_url, api_key, prometheus_url)
    add_dashboard(grafana_url, api_key, dashboard_json)
- Context: Setting up dashboards in Grafana can be time-consuming, especially when dealing with complex metrics.
- Purpose: To automate the creation of predefined dashboards in Grafana.
- How it Works: This script used Grafana’s API to create dashboards from JSON templates. It allowed for quick and consistent dashboard setup across different environments, ensuring that monitoring was always up-to-date with minimal manual effort.
4. wrapper-rds-k8s.sh
#!/bin/bash

cd ../terraform

SECRET_ARN=$(terraform output -raw rds_secret_arn)
REGION=$(terraform output -raw aws_region)

# Fetch secrets
REGION=$(terraform output -raw aws_region)
DB_CREDENTIALS=$(aws secretsmanager get-secret-value --secret-id $SECRET_ARN --region $REGION --query 'SecretString' --output text)
DB_USERNAME=$(echo $DB_CREDENTIALS | jq -r .username)
DB_PASSWORD=$(echo $DB_CREDENTIALS | jq -r .password)
DB_ENDPOINT=$(terraform output -raw rds_instance_endpoint)
DB_NAME=$(terraform output -raw rds_db_name)

cd -
# Create Kubernetes secret manifest
cat <<EOF > db-credentials.yaml
apiVersion: v1
kind: Secret
metadata:
  name: fintech-db-secret
type: Opaque
data:
  username: $(echo -n $DB_USERNAME | base64)
  password: $(echo -n $DB_PASSWORD | base64)
EOF

# Create Kubernetes ConfigMap manifest for database configuration
cat <<EOF > db-config.yaml
apiVersion: v1
kind: ConfigMap
metadata:
  name: fintech-db-config
data:
  db_endpoint: $DB_ENDPOINT
  db_name: $DB_NAME
EOF

# Apply the Kubernetes manifests
- Context: Kubernetes environments require precise configuration, especially when integrating with other services like Amazon RDS.
- Purpose: This bash script was created to automate the configuration of Kubernetes resources and ensure seamless integration with the RDS database.
- How it Works:
- ConfigMap Updates: The script facilitated updating Kubernetes ConfigMaps with database connection details. This allowed our application running in the Kubernetes cluster to connect to the RDS instance with the correct credentials and endpoints.
- Secrets Management: It also handled the creation and updating of Kubernetes Secrets. This was essential for securely storing sensitive information, such as database passwords, and making them accessible to the application pods.
Kubernetes
.
├── configmap.yaml
├── db-config.yaml
├── db-credentials.yaml
├── db-service.yaml
├── deployment.yaml
├── fintech-ingress.yaml
├── secret.yaml
├── service.yaml
└── wrapper-rds-k8s.shKubernetes, or K8s, is a powerful system for automating the deployment, scaling, and management of containerized applications.
- Creating the EKS Cluster: Using Amazon Elastic Kubernetes Service (EKS), I deployed a Kubernetes cluster. This cluster served as the backbone for managing and scaling the Docker containers.
- Seamless Integration: The Docker containers of the Flask application were efficiently managed by Kubernetes, ensuring they were properly deployed and scaled based on the application's requirements.
- Configuration Management: Kubernetes ConfigMaps and Secrets were used to manage configuration data and sensitive information, crucial for the Flask application to interact seamlessly with other components like the RDS database.
Advantages of Kubernetes in the Project
- Scalability: Kubernetes excelled in scaling the application effortlessly. It allowed the Flask app to handle varying loads by adjusting the number of running containers.
- Self-healing: Kubernetes’ self-healing capabilities automatically restarted failed containers, ensuring high availability.
- Load Balancing: Kubernetes provided efficient load balancing, distributing network traffic to ensure stable application performance.
- Easy Updates and Rollbacks: Kubernetes deployments also simplified updating the application with zero downtime and facilitated easy rollbacks to previous versions if needed.
Process of Transformation
Kubernetes Objects Creation: We created various Kubernetes objects, each serving a specific role in the application deployment:
- ConfigMap (
configmap.yaml): Used to store non-confidential configuration data, like database connection strings. - Secrets (
db-credentials.yaml,secret.yaml): Managed sensitive data like database passwords, ensuring they're stored securely and accessible only to the relevant components. - Deployment (
deployment.yaml): Defined the desired state of the application, including the Docker image to use, the number of replicas, and other specifications. - Service (
service.yaml): Provided a stable interface to access the application pods. - Ingress (
fintech-ingress.yaml): Managed external access to the application, routing traffic to the appropriate services.
- Database Integration: We used separate Kubernetes objects (
db-config.yaml,db-service.yaml) to manage the database configuration and service, ensuring a decoupled architecture where the application and database are managed independently. - Implementing Ingress: The
fintech-ingress.yamlfile for defining rules for external access to our application, including URL routing and SSL termination.
To access the app on AWS, get the address of the ingress by running
kubectl get ingress
Best Practices Implemented
- Immutable Infrastructure: We adopted the practice of immutable infrastructure by defining every aspect of our application in code, including the Kubernetes configurations. This approach reduces inconsistencies and potential errors during deployments.
- Declarative Configuration: Kubernetes objects were defined using YAML files, making our setup declarative. This method ensures that the environment is reproducible and version-controlled, which aligns with Infrastructure as Code (IaC) principles.
By leveraging them alongside Terraform and Ansible, I was able to create a highly efficient, automated, and error-resistant environment. This not only saved time but also enhanced the reliability and consistency of the infrastructure and monitoring setup.
V - GitHub CI/CD : A Detailed Overview
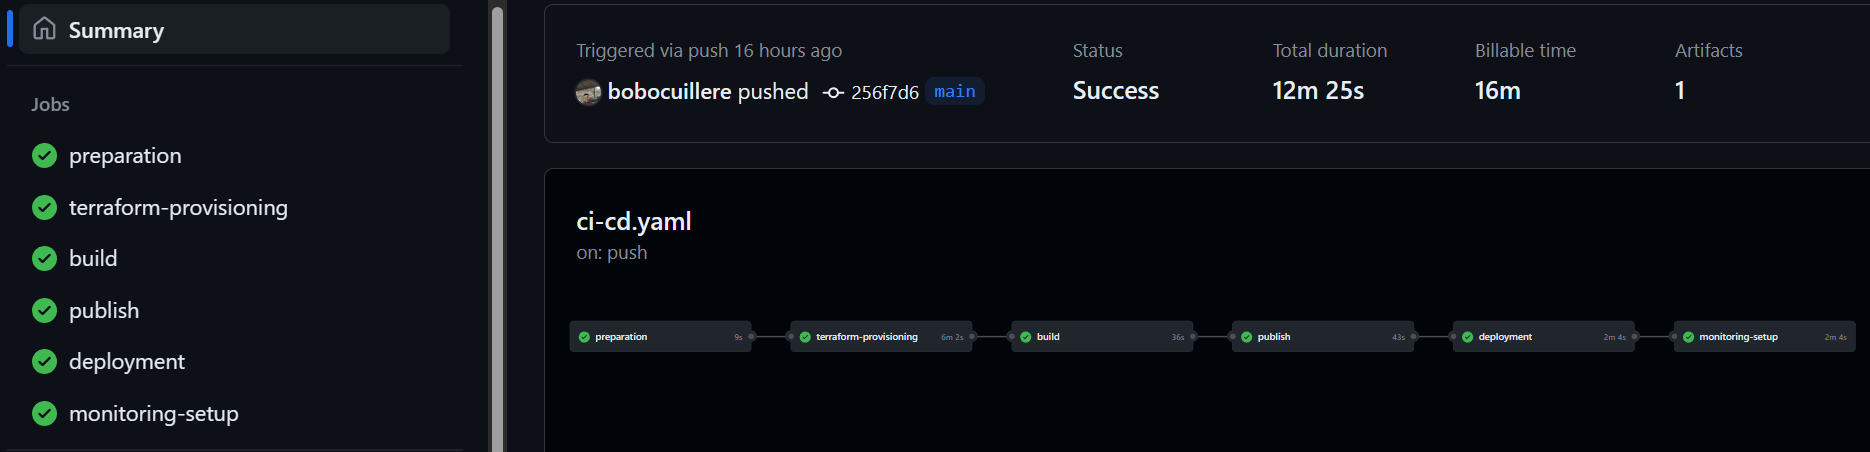
This pipeline was designed to automate the build, test, deploy, and monitoring processes, ensuring a smooth and efficient workflow. Here's an in-depth look at the choices I made :
Preparation Stage
  # ---- Preparation Stage ----
  preparation:
    runs-on: ubuntu-latest
    steps:
      - name: Checkout Code
        uses: actions/checkout@v4
      - name: Set up Docker Buildx
        uses: docker/setup-buildx-action@v2
      - name: Configure AWS credentials
        uses: aws-actions/configure-aws-credentials@v4
        with:
          aws-access-key-id: ${{ secrets.AWS_ACCESS_KEY_ID }}
          aws-secret-access-key: ${{ secrets.AWS_SECRET_ACCESS_KEY }}
aws-region: eu-central-1- Git Checkout: We started with checking out the code from the GitHub repository. This step ensures that the most recent version of the code is used in the pipeline.
- Docker Buildx Setup: Docker Buildx is an extended build tool for Docker, providing us with the ability to create multi-architecture builds. This was critical for ensuring our Docker images could run on various platforms.
- AWS Credentials Configuration: We securely configured AWS credentials using GitHub secrets. This step is crucial for allowing the pipeline to interact with AWS services like ECR and EKS.
Terraform Provisioning Stage
# ---- Terraform Provisioning Stage ----
  terraform-provisioning:
    needs: preparation
    runs-on: ubuntu-latest
    steps:
      - name: Checkout Code
        uses: actions/checkout@v4
      - name: AWS Configure Credentials
        uses: aws-actions/configure-aws-credentials@v4
        with:
          aws-access-key-id: ${{ secrets.AWS_ACCESS_KEY_ID }}
          aws-secret-access-key: ${{ secrets.AWS_SECRET_ACCESS_KEY }}
          aws-region: eu-central-1

      - name: Set up Terraform
        uses: hashicorp/setup-terraform@v3
      - name: Terraform Init and Apply
        run: |
          cd ./terraform
          terraform init
          terraform apply -auto-approve
- Infrastructure as Code: We used Terraform, to manage and provision our cloud infrastructure. Terraform's declarative configuration files allowed us to automate the setup of AWS resources like EKS clusters, RDS instances, and VPCs.
- Init and Apply: Terraform's
initandapplycommands were used to initialize the working directory containing Terraform configurations and to apply the changes required to reach the desired state of the configuration.
Build Stage
# ---- Build Stage ----
  build:
    needs: terraform-provisioning
    runs-on: ubuntu-latest
    steps:
      - name: Checkout Code
        uses: actions/checkout@v4
      - name: AWS Configure Credentials
        uses: aws-actions/configure-aws-credentials@v4
        with:
          aws-access-key-id: ${{ secrets.AWS_ACCESS_KEY_ID }}
          aws-secret-access-key: ${{ secrets.AWS_SECRET_ACCESS_KEY }}
          aws-region: eu-central-1

      - name: Build Docker Image
        run: docker build -t fintech-app-repo:${{ github.sha }} ./src
      - name: Save Docker Image
        run: |
          docker save fintech-app-repo:${{ github.sha }} > fintech-app.tar
      - name: Upload Docker Image Artifact
        uses: actions/upload-artifact@v4
        with:
          name: docker-image
          path: fintech-app.tar
- Docker Image Building: We built Docker images for our application, tagging them with the specific GitHub SHA - a unique identifier for each commit.
- Artifact Uploading: The built Docker images were saved and uploaded as artifacts, which could be used in subsequent stages of the pipeline.
Publish Stage
# ---- Publish Stage ----
  publish:
    needs: build
    runs-on: ubuntu-latest
    steps:
      - name: AWS Configure Credentials
        uses: aws-actions/configure-aws-credentials@v4
        with:
          aws-access-key-id: ${{ secrets.AWS_ACCESS_KEY_ID }}
          aws-secret-access-key: ${{ secrets.AWS_SECRET_ACCESS_KEY }}
          aws-region: eu-central-1
      - name: Login to Amazon ECR
        uses: aws-actions/amazon-ecr-login@v2
      - uses: actions/download-artifact@v4
        with:
          name: docker-image
          path: .
      - name: Load Docker Image
        run: docker load < fintech-app.tar
      - uses: aws-actions/amazon-ecr-login@v2
      - name: Push Docker Image to Amazon ECR
        run: |
          docker tag fintech-app-repo:${{ github.sha }} ${{ secrets.ECR_REGISTRY }}:${{ github.sha }}
docker push ${{ secrets.ECR_REGISTRY }}:${{ github.sha }}- ECR Login and Image Push: We logged into AWS Elastic Container Registry (ECR) and pushed our Docker images. This ensured our images were stored in a secure, scalable, and managed AWS Docker container registry.
Deployment Stage
# ---- Deployment Stage ----
  deployment:
    needs: publish
    runs-on: ubuntu-latest
    steps:
      - name: Checkout Code
        uses: actions/checkout@v4
      - name: AWS Configure Credentials
        uses: aws-actions/configure-aws-credentials@v4
        with:
          aws-access-key-id: ${{ secrets.AWS_ACCESS_KEY_ID }}
          aws-secret-access-key: ${{ secrets.AWS_SECRET_ACCESS_KEY }}
          aws-region: eu-central-1
      - name: Retrieve and Set up Kubernetes Config
        run: |
          cd ./terraform
          terraform init
          eval "$(terraform output -raw configure_kubectl)"

      - name: Install eksctl
        run: |
          ARCH=amd64
          PLATFORM=$(uname -s)_$ARCH
          curl -sLO "https://github.com/eksctl-io/eksctl/releases/latest/download/eksctl_$PLATFORM.tar.gz"
          tar -xzf eksctl_$PLATFORM.tar.gz -C /tmp
          sudo mv /tmp/eksctl /usr/local/bin

      - name: Check and Add IAM User to EKS Cluster
        env:
          CLUSTER_NAME: fintech-eks-cluster # Replace with your actual cluster name
          USER_ARN: ${{ secrets.USER_ARN }}
        run: |
          # Check if the user is already mapped to the EKS cluster
          if eksctl get iamidentitymapping --cluster "$CLUSTER_NAME" --arn "$USER_ARN" | grep -q "$USER_ARN"; then
            echo "User ARN $USER_ARN is already mapped to the EKS cluster"
          else
            # Add the user to the EKS cluster
            eksctl create iamidentitymapping --cluster "$CLUSTER_NAME" --arn "$USER_ARN" --username wsl2 --group system:masters
            echo "User ARN $USER_ARN added to the EKS cluster"
          fi

      - name: run k8s script
        run: |
          cd ./k8s/
          chmod +x ./wrapper-rds-k8s.sh
          ./wrapper-rds-k8s.sh

      - name: Update Kubernetes Deployment Image Tag
        run: |
          sed -i "s|image:.*|image: ${{ secrets.ECR_REGISTRY }}:${{ github.sha }}|" ./k8s/deployment.yaml

      - name: Apply Kubernetes Ingress
        run: |
          kubectl apply -f https://raw.githubusercontent.com/kubernetes/ingress-nginx/controller-v1.8.2/deploy/static/provider/aws/deploy.yaml
          sleep 25
      - name: Apply Kubernetes Manifests
        run: |
          kubectl apply -f ./k8s/
          sleep 30

      - name: Check Pods Status
        run: kubectl get pods -o wide

      - name: Get Ingress Address
        run: kubectl get ingress -o wide
- Kubernetes Configuration: We retrieved and set up Kubernetes configuration using outputs from Terraform. This allowed us to interact with our EKS cluster.
- IAM Identity Mapping: We checked and added IAM users to the EKS cluster using
eksctl, enhancing our cluster's access and security management (I created a specific IAM user for the ci-cd pipeline but I wanted to interact with the cluster on my local machine which have another IAM user). - Kubernetes Script Execution: Executed a custom bash script (
wrapper-rds-k8s.sh) to manage Kubernetes resources and settings, showcasing our ability to automate complex Kubernetes tasks. - Image Update and Manifests Application: Updated the Kubernetes deployment image tags and applied various Kubernetes manifests, including deployment and service configurations.
Monitoring Setup Stage
 # ---- Monitoring Setup Stage ----
  monitoring-setup:
    needs: deployment
    runs-on: ubuntu-latest
    steps:
      - name: Checkout Code
        uses: actions/checkout@v4
      - name: AWS Configure Credentials
        uses: aws-actions/configure-aws-credentials@v4
        with:
          aws-access-key-id: ${{ secrets.AWS_ACCESS_KEY_ID }}
          aws-secret-access-key: ${{ secrets.AWS_SECRET_ACCESS_KEY }}
          aws-region: eu-central-1
      - name: install with pip the following packages
        run: |
          pip3 install boto3
          pip3 install requests
          pip3 install python-dotenv

      - name: Update Inventory with Latest IP Addresses
        run: |
          cd ./terraform
          terraform init
          cd ../ansible
          python3 update_inventory.py

      - name: Create PEM Key File
        run: |
          cd ./ansible
          echo -e "${{ secrets.PEM_KEY }}" > ../terraform/fintech-monitoring.pem
          chmod 400 ../terraform/fintech-monitoring.pem

      - name: ansible playbook for the monitoring
        run: |
          cd ./ansible
          ansible-playbook playbook.yml -vv

      - name: Generate Grafana API Key and Update AWS Secret
        run: |
          cd ./ansible
          python3 generate_grafana_api_key.py

      - name: Add Dashboard to Grafana
        run: |
          cd ./ansible
          python3 add_grafana_dashboard.py
- Ansible Playbook Execution: Used Ansible to configure Prometheus and Grafana on our AWS infrastructure. This automated the setup and ensured consistent configuration across environments.
- Python Scripts for Grafana: Automated Grafana dashboard creation and API key management using custom Python scripts. This demonstrated our capability to integrate different technologies for a comprehensive monitoring solution.
Best Practices and Key Takeaways
- Securing Secrets: We used GitHub secrets to manage sensitive information, ensuring that credentials were not hardcoded or exposed in the pipeline.
- Modular Approach: By structuring our CI/CD pipeline into distinct stages, we achieved clarity and better control over each phase of the deployment process.
- Infrastructure as Code: Leveraging Terraform for provisioning allowed us to maintain a consistent and reproducible infrastructure setup, reducing manual errors and improving efficiency.
- Containerization and Registry Management: Using Docker and ECR ensured that our application was packaged consistently and stored securely, facilitating smoother deployments.
- Automated Monitoring Setup: The integration of Ansible and custom Python scripts for setting up Prometheus and Grafana streamlined our monitoring setup, illustrating our focus on automation and reliability.
VI - Lessons Learned and Growth
As I conclude this project, it's important to reflect on the lessons learned and the personal and professional growth that came with it.
Understanding the Full Spectrum: From coding in Python to orchestrating containers with Kubernetes, every step was a puzzle piece, contributing to a bigger picture.
The Power of Automation: One of the key takeaways from this experience is the incredible power and efficiency of automation. Whether it was using Terraform for infrastructure setup, Ansible for configuration, or GitHub Actions for CI/CD, automating repetitive and complex tasks not only saved time but also reduced the scope for errors.
Collaboration and Community: The role of community resources and collaboration was invaluable. Whether it was seeking help from online forums, GitHub repositories, or directly friends.